
The Taunton Municipal Lighting Plant provides electric service to the following communities:
- City of Taunton
- Town of Raynham
- Town of Berkley
- portions of the Town of Dighton
- portions of the Town of Lakeville
- portions of the Town of Bridgewater
| General Statistics for 2024 | |
| Territory Served (square miles) | 100 |
| Number of Customers served | 39,434 |
| Peak Load (MW) | 136.69 |
| Annual Retail Sales (kwh) | 634,011,959 |
| Annual Retail Revenues | $127,854,166 |
| Annual Electrical Usage (KWH) by Customer Classification | |
| Residential Customer | 284,183,084 |
| General Service | 62,584,269 |
| Large General Service | 84,137,791 |
| Industrial Primary Service | 184,318,570 |
| Street & Private Area Lighting | 4,553,751 |
| TMLP Production Capacity in KW | |
| TMLP Unit 9 Combined Cycle | 110,000 |
| Transmission & Distribution | |
| Transmission | 8.12 Miles |
| Distribution Lines (Overhead) | 550 Miles |
| Distribution Lines (Underground) | 36 Miles |
| Substations & Capacity | 17 Units |
| Distribution Capacity | 336,603 kva |
| Distribution Transformers | 6328 Units |
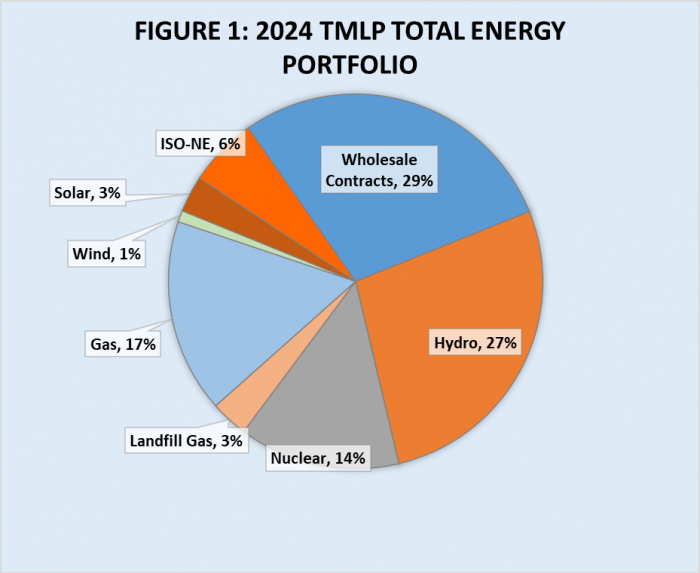
TMLP’s power portfolio is comprised of a diverse mix of carbon-free, renewable, and traditional generation sources. Some of these resources we own, while others we have contractual agreements to receive the output of specific generators, and lastly we fill the rest of the portfolio with wholesale market power. The “Power Sources” table above represents a breakdown of the all the assets that we own directly or those for which we contractually own the output, shown here in the “Known Resources” category. We also sign “wholesale contracts” to lock in rates with suppliers, and lastly leave a portion open to ISO-NE’s wholesale energy market, both of which are included in the “Wholesale Resources” category. The total of these two categories is our total fuel mix which is compared to ISO-NE’s reported fuel mix.
